Wichita Foundation Statistics 2026
Published November 2, 2026 · Sources checked November 2, 2026
Written by Arthur Smelyansky, Publisher, Level Ground · Last updated: November 2, 2026
Wichita's foundation guidance distinguishes a frost criterion from a footing-depth requirement, while its regional permit total covers many kinds of construction. Those distinctions matter more than treating a large number as proof of repair demand. This reference brings together ten findings about Wichita households, airport climate normals and MABCD documents. It is for homeowners and writers who need a dated, attributable number. The figures describe different populations and periods; none establishes the condition of an individual foundation.
Every finding links to its original publisher. The year in the title is the review year; the data periods remain beside the numbers. For property-level questions, start with our local foundation repair guide.
Key Takeaways
- 158,589 households. U.S. Census Bureau (2020-2024 ACS).
- 58.9% owner-occupied. U.S. Census Bureau (2020-2024 ACS).
- 34.31 inches annual precipitation. NOAA NCEI (1991-2020 climate normals).
- May: 5.17 inches. NOAA NCEI (1991-2020 climate normals).
- 24-inch frost criterion versus 30-inch minimum in the cited foundation guidance. MABCD (March 2026).
- 34,813 permits of all types in 2025. MABCD (2025, reported April 2026).
Contents
- How large is the resident household base?
- Who owns the occupied housing?
- What is the housing value context?
- What is the long-run rainfall baseline?
- When is the wettest average month?
- How concentrated is the wetter season?
- How often does heavier daily rain occur?
- What is the winter exposure?
- Which local depth numbers are easily confused?
- What does regional construction activity show?
- Methodology and limits
- Frequently asked questions
- Sources
How large is the resident household base?
158,589 households is the Census estimate for Wichita city, Kansas, based on the 2020-2024 ACS. It describes occupied households across the city rather than a count of detached houses, foundations or basements. U.S. Census Bureau.
The household estimate describes the city, whereas the MABCD construction total later on this page covers a broader service area. Keep those boundaries separate when discussing the scale of local housing or construction.
| Measure | Value / scope |
|---|---|
| Finding | 158,589 households |
| Geography | Wichita city, Kansas |
| Data period / document | 2020-2024 ACS |
| Measure type | ACS five-year estimate |
Table 1: ACS five-year estimate. U.S. Census Bureau; 2020-2024 ACS. City boundary only; includes renters and non-basement homes. Not a repair-demand count.
Who owns the occupied housing?
58.9% of occupied housing units were owner-occupied in Wichita city, Kansas in the 2020-2024 ACS. The denominator is occupied housing units; it is not all residents or all buildings. U.S. Census Bureau.
Ownership is relevant to who may authorize work, but this proportion does not identify which owners need a foundation assessment. It is a housing-tenure estimate across occupied units, not a count of foundation-repair prospects.
| Measure | Value / scope |
|---|---|
| Finding | 58.9% owner-occupied |
| Geography | Wichita city, Kansas |
| Data period / document | 2020-2024 ACS |
| Measure type | ACS five-year estimate |
Table 2: ACS five-year estimate. U.S. Census Bureau; 2020-2024 ACS. Ownership share does not measure foundation or basement problems.
What is the housing value context?
$190,800 was the median value of owner-occupied housing units in Wichita city, Kansas in the 2020-2024 ACS. This is a housing-value estimate, not a sale-price series or an estimate of repair cost. U.S. Census Bureau.
The value estimate provides housing context. It is not a typical repair invoice or a budget recommendation. A house value cannot establish which repair is appropriate or what a contractor should charge for a defined scope.
| Measure | Value / scope |
|---|---|
| Finding | $190,800 median owner-occupied home value |
| Geography | Wichita city, Kansas |
| Data period / document | 2020-2024 ACS |
| Measure type | ACS five-year estimate |
Table 3: ACS five-year estimate. U.S. Census Bureau; 2020-2024 ACS. Home value is not repair cost or ability to pay.
What is the long-run rainfall baseline?
34.31 inches is the annual precipitation normal for WICHITA, KS US, station USW00003928, for 1991-2020. Precipitation is a water-equivalent measure, including frozen precipitation; this figure is not an observation for 2026. NOAA NCEI.
Use this baseline when describing Wichita climate, with the station and period attached. It does not tell you how much rain fell at a house this year, how soil behaved beside that house or whether its foundation moved.
| Measure | Value / scope |
|---|---|
| Finding | 34.31 inches annual precipitation |
| Geography | WICHITA, KS US; USW00003928 |
| Data period / document | 1991-2020 climate normals |
| Measure type | Climate normal |
Table 4: Climate normal. NOAA NCEI; 1991-2020 climate normals. Airport station baseline, not a 2026 observation.
When is the wettest average month?
May, at 5.17 inches, has the highest monthly precipitation normal in the 1991-2020 series for WICHITA, KS US. The comparison uses all twelve monthly values from the same station and period. NOAA NCEI.
The monthly series identifies the wettest average month at the station. It can help organize a seasonal discussion, but it does not set a project deadline or supply a design-storm intensity for drainage work.
| Measure | Value / scope |
|---|---|
| January | 0.85 inches |
| February | 1.20 inches |
| March | 2.30 inches |
| April | 3.10 inches |
| May | 5.17 inches |
| June | 4.93 inches |
| July | 3.98 inches |
| August | 4.30 inches |
| September | 3.05 inches |
| October | 2.85 inches |
| November | 1.36 inches |
| December | 1.22 inches |
Table 5: Monthly normal comparison. NOAA NCEI; 1991-2020 climate normals. Average monthly total is not design storm intensity.
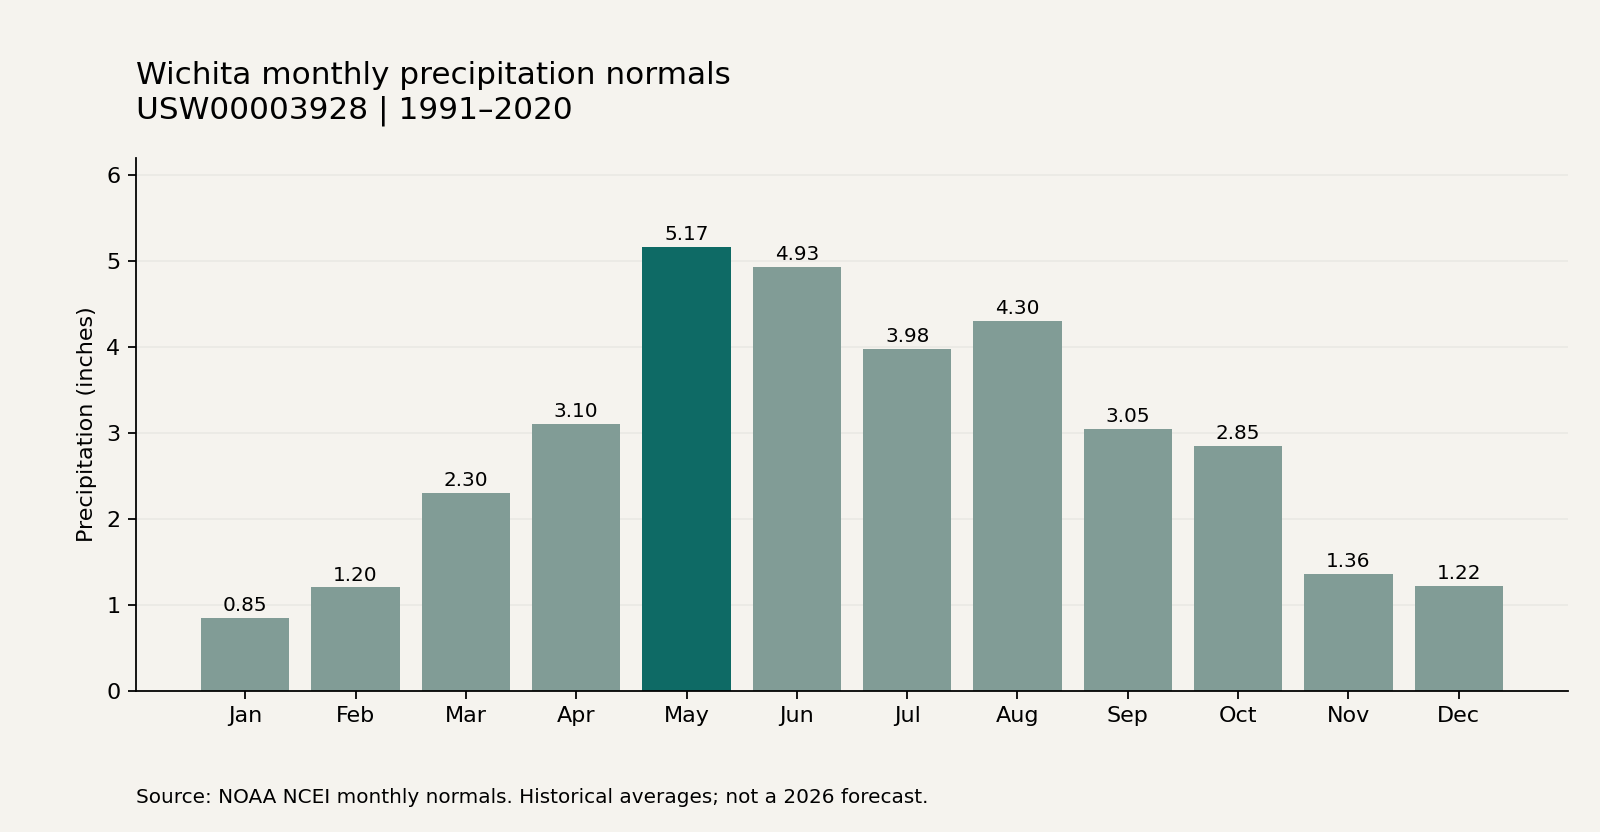
Chart: Level Ground, using the linked NOAA monthly series for 1991-2020. Exact values appear in the table.
How concentrated is the wetter season?
23.78 inches is the sum of the March-August precipitation normals for WICHITA, KS US, using 1991-2020 data. This is our calculation from six published monthly values, not a separate NOAA seasonal statistic. NOAA NCEI.
The calculation adds the same six calendar months from one station and one normal period. It is an editorial summary of the published values, not a separate observation or an estimate of water reaching a foundation.
| Measure | Value / scope |
|---|---|
| March | 2.30 inches |
| April | 3.10 inches |
| May | 5.17 inches |
| June | 4.93 inches |
| July | 3.98 inches |
| August | 4.30 inches |
| March-August sum | 23.78 inches |
Table 6: Derived seasonal sum. NOAA NCEI; 1991-2020 climate normals. Sum of six monthly normals; no damage inference.
Calculation: 2.30 + 3.10 + 5.17 + 4.93 + 3.98 + 4.30 = 23.78 inches. Each input is a published monthly normal; no annual share or damage estimate is inferred.
How often does heavier daily rain occur?
10.7 days per year is the station normal for days with at least 1.00 inch of precipitation at WICHITA, KS US, during 1991-2020. It is an average frequency, not a return period or a count of storms expected in a future year. NOAA NCEI.
Days meeting this threshold are one view of the historical precipitation pattern. They are not recorded flooding incidents, homeowner claims or foundation failures. Do not multiply this frequency by the household count to estimate repair demand.
| Measure | Value / scope |
|---|---|
| Finding | 10.7 days/year with at least 1 inch |
| Geography | WICHITA, KS US; USW00003928 |
| Data period / document | 1991-2020 climate normals |
| Measure type | Climate-normal frequency |
Table 7: Climate-normal frequency. NOAA NCEI; 1991-2020 climate normals. A historical average frequency, not a forecast or return period.
What is the winter exposure?
102.8 days per year is the normal for days with a minimum air temperature at or below 32°F at WICHITA, KS US, for 1991-2020. The measure counts cold days, not ground freeze-thaw cycles. NOAA NCEI.
A daily minimum at or below freezing does not measure ground freezing depth. Keep this weather frequency separate from the MABCD frost and foundation guidance below; the variables answer different questions.
| Measure | Value / scope |
|---|---|
| Finding | 102.8 days/year with minimum temperature at or below 32°F |
| Geography | WICHITA, KS US; USW00003928 |
| Data period / document | 1991-2020 climate normals |
| Measure type | Climate-normal frequency |
Table 8: Climate-normal frequency. NOAA NCEI; 1991-2020 climate normals. Cold days are not a count of ground freeze-thaw cycles.
Which local depth numbers are easily confused?
24 inches is the frost criterion discussed in MABCD's March 2026 newsletter; 30 inches below finished grade is its stated footing or grade-beam minimum even for the described PI 0-15 condition. The two depths are not interchangeable. MABCD.
The newsletter describes two different design considerations. Its minimum applies within the low-PI condition it discusses and does not supply a universal detail for every foundation or repair. Confirm the current adopted requirements and site assumptions with the responsible authority.
| Measure | Value / scope |
|---|---|
| Frost criterion in the newsletter | 24 inches |
| Minimum for the described low-PI footing/grade-beam condition | 30 inches below finished grade |
| Document status | Informational guidance; confirm adopted requirements |
Table 9: Guidance comparison. MABCD; March 2026. Guidance for the structures it discusses; check the current adopted requirements for the actual job.
What does regional construction activity show?
34,813 permits of all types were issued by MABCD in 2025, according to its April 2026 year-in-review newsletter. This is a regional administrative activity total; it does not isolate foundation work or the City of Wichita alone. MABCD.
The published total includes all permit types in MABCD's service area. It is not a count of Wichita foundation repairs, unique properties or available jobs. Measuring repair activity would require the underlying permit categories and a method for identifying duplicate project records.
| Measure | Value / scope |
|---|---|
| Finding | 34,813 permits of all types in 2025 |
| Geography | MABCD service area, all permit types |
| Data period / document | 2025, reported April 2026 |
| Measure type | Administrative permit count |
Table 10: Administrative permit count. MABCD; 2025, reported April 2026. MABCD service area, all types. Not Wichita foundation repairs or unique projects.
Methodology and limits
Download the source ledger · Read the calculation inputs.
This reference uses primary-publisher material checked on November 2, 2026. The Census entries are 2020-2024 ACS estimates; weather values are 1991-2020 station normals; local documents retain their own dates. Figures were matched to their source rows or document sections. Census QuickFacts was checked against its publisher page; NOAA and MABCD records were also retained for verification. The seasonal sum is calculated above. Ten headline findings are counted once each; repeated summaries, monthly input rows and program dates are supporting detail, not extra headline statistics. Rules and recommendations are labeled separately from measured activity.
Source mix: three Census findings, five NOAA findings and two MABCD findings. The original periods and source links appear beside each number.
What remains unknown: these sources do not establish local average repair prices, the number of affected homes, available jobs, lead volume or a forecast of 2027 repairs. No property diagnosis or project eligibility is inferred.
Changelog: November 2, 2026: published the initial ten-finding reference with dated sources, the monthly table and a reproducible seasonal calculation. The source periods are preserved. Updates will identify changes to the source or explanation.
Frequently Asked Questions
Does this page measure foundation-repair demand?
No. The 158,589 household figure is a city housing estimate for 2020-2024, not a count of affected buildings. Climate normals, permit totals and guidance thresholds also have different denominators. A repair-demand claim would need an appropriate incident or project dataset. U.S. Census Bureau.
Are the weather figures observations from 2026?
No. The 1991-2020 normals describe the published climate baseline at WICHITA, KS US. The 34.31-inch annual precipitation value is not this year's rainfall. The 2026 page date records when we checked and compiled the sources. NOAA NCEI.
How was the seasonal total calculated?
We added six monthly normals, March through August, from the same NOAA station and 1991-2020 period. The result is 23.78 inches. The inputs and arithmetic appear above and in the downloadable ledger. This is our reproducible sum, not a count of flooding or repair incidents. NOAA NCEI.
Can I use the frost number as the footing requirement?
Not by itself. MABCD's March 2026 discussion distinguishes 24 inches for frost from a 30-inch footing or grade-beam minimum in its described low-PI condition. The applicable requirements and soil conditions still need checking for the actual work. Read the source in its stated scope. MABCD.
Sources
- U.S. Census Bureau; 2020-2024 ACS. Checked November 2, 2026.
- NOAA NCEI; 1991-2020 climate normals. Checked November 2, 2026.
- NOAA NCEI; 1991-2020 climate normals. Checked November 2, 2026.
- MABCD; March 2026. Checked November 2, 2026.
- MABCD; 2025, reported April 2026. Checked November 2, 2026.
Definitions and project questions
plasticity index · expansive soil · differential settlement. These definitions explain the terminology. The glossary also links the other completed entries; a definition does not replace a property assessment.
Cite this resource
Suggested citation: Arthur Smelyansky. “Wichita Foundation Statistics 2026.” Level Ground. Updated November 2, 2026. https://levelgroundict.com/wichita-foundation-statistics/
When citing a specific number, retain its original publisher, geography and data period. Link to this page and the original source when using a figure.